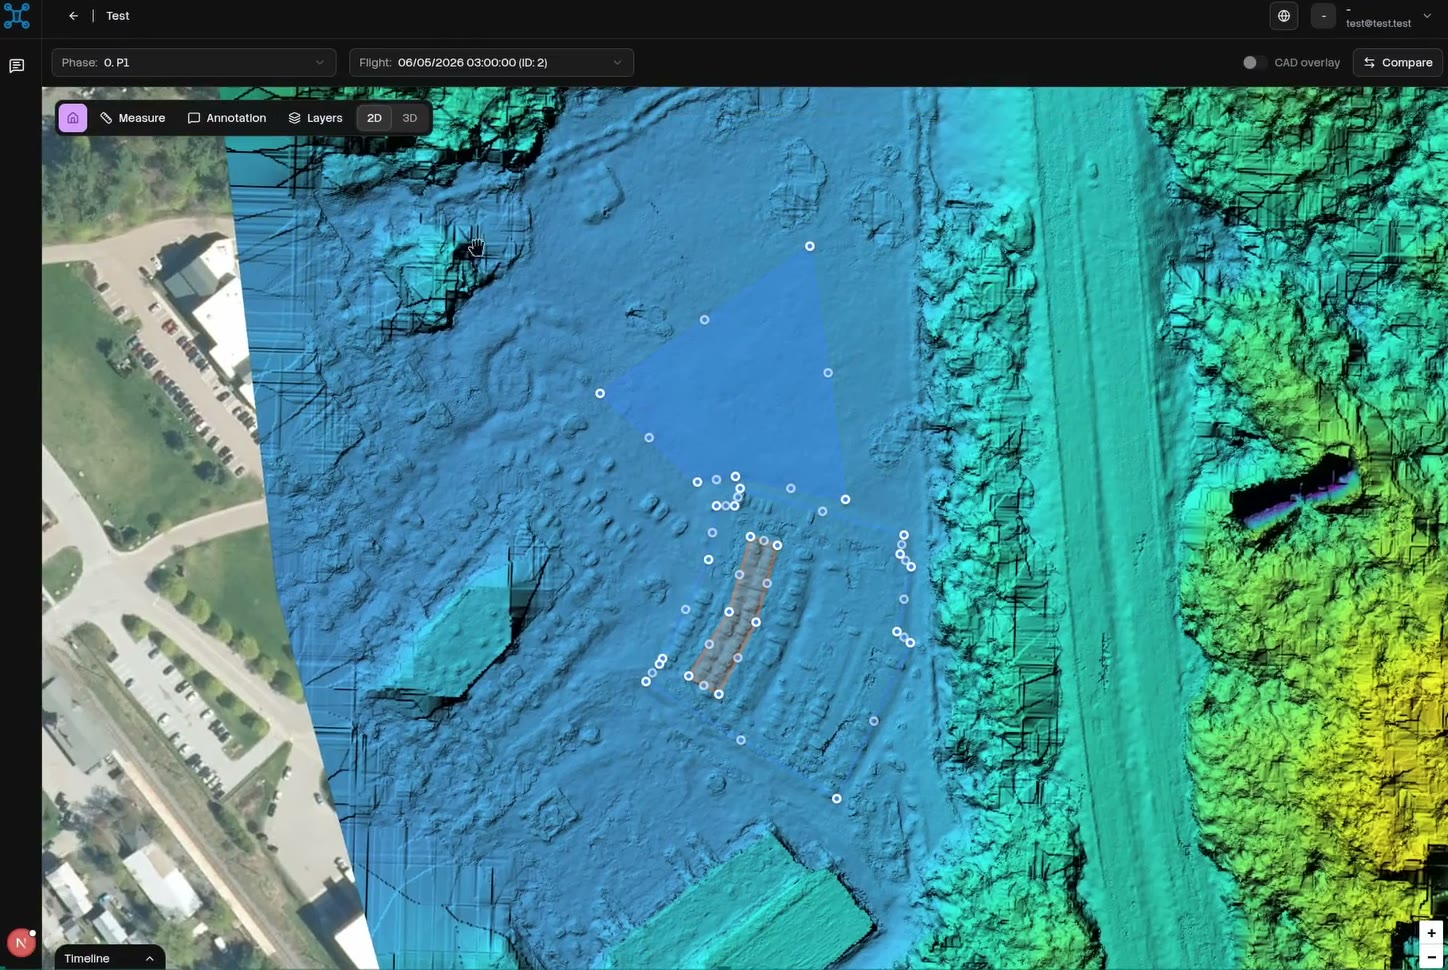
A UAE real estate developer was running parks, road networks, roundabouts and mixed-use projects in parallel, and tracking their progress through site visits and spreadsheets. I led design and product decisions across seven modules, from flight upload to the executive dashboard, and built production frontend.
- Role
- Product manager, product designer, design engineer
- Year
- 2025 to 2026
- Stack
- Three.js, Potree, Leaflet, Claude Code
Problem
The developer had more than five active sites and over a thousand drone images on the main one. Reports to government bodies and investors lagged one to two weeks behind reality, and contractors reported their progress as estimates.
The data existed, but the evidence did not. Each flight produced folders of images that needed separate tools to process, while schedules and design files lived somewhere else. There was no single view that showed what had been built against what had been planned.
Three audiences needed different things. Site managers wanted detail and measurements, contractors should only see their own scope, and executives needed the whole portfolio on one screen.
Approach
Every flight should produce a report. Upload the flight, and within minutes get a progress report with the visual evidence attached, with no third-party tools, no manual file handling and no estimate without proof.
Decisions
Progress by component, not one percentage
"62% complete" means very little for a project that includes a park, a road network and a roundabout. So each project is broken into its real components, each with its own progress and status. The roundabout can be ahead while the park is delayed, and the screen shows both.
Every estimate shows its evidence
An AI number nobody can check starts arguments instead of settling them. Every estimate comes with a confidence level and the imagery it was based on, so clicking the number takes you to the site itself.
Compare two flights, not two folders
The real question is always what changed. Two flights sit side by side with synchronized navigation, so panning one moves the other. Design drawings overlay on top with adjustable opacity, which turns design versus reality into a slider.
Measure where you look
Distance, area and earthwork volume are measured on the processed imagery in the browser, with no export and no desktop GIS tool. A site manager can check a cut and fill volume while still on the call.
Permissions shape the product
Role-based access was part of the design from the start. Contractors see their own projects, managers see their portfolio, and executives see everything in summary. It is one product with three different entry screens.
Design engineering
I designed the product and built production frontend with agents, the same way I work on everything else, so the design rules lived in the code rather than in a spec document.
Heavy 2D and 3D interfaces are easy to make impressive and hard to make usable, so I held to a few rules:
The map or model is the page, and panels float over it.
Every tool has one job and an obvious way out.
Loading states are designed for processing that takes minutes, so nobody uploads the same flight twice.
Annotations pin to the 2D or 3D model, so every comment has a location.
The interface was Arabic and English from day one. Right to left is not a mirror switch, and panels, charts, measurements and map controls each needed an explicit decision about which way they read.
Agents also helped me map Phase 2, turning stakeholder input into a scoped roadmap of 33 features.
Outcome
Project managers now get progress reports minutes after a flight instead of after a site visit, and conversations with contractors, investors and government run on images everyone can see.
- Modules shipped
- 7
- Active sites
- 5+
- Images on the main site
- 1,000+
- Reporting lag
- 1 to 2 weeks down to minutes after upload
- Phase 2 features mapped
- 33